Mạch tương đương đơn giản của tế bào quang điện Mạch tương đương đơn giản của tế bào quang điện... Mạch tương đương đơn giản của tế bào quang điện Mạch tương đương đơn giản của tế bào
Trang 10
Bài
Bài giảnggiảnggiảng::::
NĂNG LƯỢNG TÁI TẠO
Giảng viên: ThS Trần Công Binh
4/2012
C2: NĂNG LƯỢNG ĐIỆN MẶT TRỜI
1 Nguồn năng lượng mặt trời
2 Tế bào quang điện
3 Đặc tuyến I-V của pin quang điện
4 Công nghệ chế tạo pin quang điện
5 Đặc tính làm việc của pin quang điện
6 Hệ điện mặt trời độc lập
7 Hệ điện mặt trời hòa lưới
Trang 2The Solar Resource
• Before we can talk about solar power, we need to talk
about the sun
• Need to know how much sunlight is available
• Can predict where the sun is at any time
• Insolation : incident solar radiation
• Want to determine the average daily insolation at a site
• Want to be able to chose effective locations and panel
tilts of solar panels
The Sun and Blackbody Radiation
• The sun
– 1.4 million km in diameter
– 3.8 x 10 20 MW of radiated electromagnetic energy
• Blackbodies
– Both a perfect emitter and a perfect absorber
– Perfect emitter – radiates more energy per unit of surface area
than a real object of the same temperature
– Perfect absorber – absorbs all radiation, none is reflected
Trang 3Visible light has a wavelength of between 0.4 and 0.7 µm, with
ultraviolet values immediately shorter, and infrared immediately longer
Trang 4Area under curve is the total radiant power emitted
Stefan-Boltzmann Law
• Total radiant power emitted is given by the Stefan –
Boltzman law of radiation
Trang 5Wien’s Displacement Rule
• The wavelength at which the emissive power per unit
area reaches its maximum point
max
2898 (7.3)
T
λ =
• T = absolute temperature (K)
• λmax=0.5 µm for the sun , T = 5800 K
• λmax= 10.1 µm for the earth (as a blackbody), T = 288 K
Extraterrestrial Solar Spectrum
Figure 7.2
Trang 6Air Mass Ratio
• h 1 = path length through atmosphere with sun directly
overhead
• h 2= path length through atmosphere to spot on surface
• β = altitude angle of the sun
Figure 7.3
As sunlight passes through the atmosphere, less energy arrives at the earth’s surface
Air Mass Ratio
• Air mass ratio of 1 (“AM1”) means sun is directly
overhead (m=1)
• AM0 means no atmosphere
• AM1.5 is assumed average at the earth’s surface (m=1.5)
2 1
1air mass ratio = (7.4)
sin
h m
=
Figure 7.3
Trang 7Solar Spectrum on Surface
m increases
as the sun appears lower in the sky Notice there is
a large loss towards the blue end for higher m, which is why the sun appears reddish at sun rise and sun set
The Earth’s Orbit
• One revolution every 365.25 days
• Distance of the earth from the sun
• n = day number (Jan 1 is day 1)
• d (km) varies from 147x106km on Jan 2 to 152x106
km on July 3 (closer in winter, further in summer)
• Note that the angles in this chapter are in degrees
Trang 8The Earth’s Orbit
• In one day, the earth rotates 360.99˚
• The earth sweeps out what is called the ecliptic plane
• Earth’s spin axis is currently 23.45˚
• Equinox – equal day and night, on March 21 and
September 21
• Winter solstice – North Pole is tilted furthest from the
sun
• Summer solstice – North Pole is tilted closest to the sun
The Earth’s Orbit
Figure 7.5
For solar energy applications, we’ll consider the characteristics of
the earth’s orbit to be unchanging
Trang 9Solar Declination
• Solar declination δ – the angle formed between the
plane of the equator and the line from the center of the
sun to the center of the earth
• δ varies between +/- 23.45˚
• Assuming a sinusoidal relationship, a 365 day year, and
n=81 is the spring equinox, the approximation of δ for
any day n can be found from
36023.45sin 81 (7.6)
365 n
δ = −
The Sun’s Position in the Sky
• Predict where the sun will be in the sky at any time
• Pick the best tilt angles for photovoltaic (PV) panels
Figure 7.6
• Another
perspective-Solar declination
Trang 10Solar Noon and Collector Tilt
• Solar noon – sun is
directly over the local
• During solar noon, the sun’s rays are
perpendicular to the collector face
Figure 7.8
• Altitude angle at solar noon β N – angle between the sun
and the local horizon
• Zenith – perpendicular axis at a site
90 (7.7)
β = ° − +δ
Figure 7.9
Trang 11Example 7.2 – Tilt of a PV Module
• Find the optimum tilt angle for a south-facing PV
module located at in Tucson (latitude 32.1˚) at solar
noon on March 1
• From Table 7.1, March 1 is day n = 60
Example 7.2 – Tilt of a PV Module
• The solar declination δ is
• The altitude angle is
• To make the sun’s rays perpendicular to the panel, we
need to tilt the panel by
Trang 12Solar Position at Any Time of Day
• Described in terms of altitude angle β and azimuth
angle of the sun ϕ S
• β and ϕ Sdepend on latitude, day number, and time of
day
• Azimuth angle (ϕ S) convention
– positive in the morning when sun is in the east
– negative in the evening when sun is in the west
– reference in the Northern Hemisphere (for us) is true south
• Hours are referenced to solar noon
Altitude Angle and Azimuth Angle
Figure 7.10 Azimuth Angle
Altitude Angle
Trang 13Altitude Angle and Azimuth Angle
• Hour angle H- the number of degrees the earth must
rotate before sun will be over your line of longitude
• If we consider the earth to rotate at 15˚/hr, then
• At 11 AM solar time, H = +15˚ (the earth needs to
rotate 1 more hour)
• At 2 PM solar time, H = -30˚
15hour angle hours before solar noon (7.10)
hour
H = ° ⋅
Altitude Angle and Azimuth Angle
sinβ =cos cos cosL δ H+sin sin (7.8) L δ
cos sinsin (7.9)
cos
S
H
δφ
β
=
• L = latitude (degrees)
• Test to determine if the angle magnitude is less than or
greater than 90˚ with respect to true
Trang 14Example 7.3 – Where is the Sun?
• Find altitude angle β and azimuth angle ϕ Sat 3 PM solar
time in Boulder, CO (L = 40˚) on the summer solstice
• At the solstice, we know the solar declination δ ˚ = 23.45
• Hour angle H is found from (7.10)
• The altitude angle is found from (7.8)
15
-3 h 45h
Example 7.3 – Where is the Sun?
• The sin of the azimuth angle is found from (7.9)
• Two possible azimuth angles exist
• Apply the test (7.11)
S
φ − ° °
Trang 15Sun Path Diagrams for Shading
Analysis
• Now we know how to locate the sun in the sky at any
time
• This can also help determine what sites will be in the
shade at any time
• Sketch the azimuth and altitude angles of trees,
buildings, and other obstructions
• Sections of the sun path diagram that are covered
indicate times when the site will be in the shade
Sun Path Diagram for Shading
Analysis
• Trees to the southeast, small building to the southwest
• Can estimate the amount of energy lost to shading
Figure 7.15
Trang 16California Solar Shade Control Act
• The shading of solar collectors has been an area of legal
and legislative concern (e.g., a neighbor’s tree is blocking
a solar panel)
• California has the Solar Shade Control Act (1979) to
address this issue
– No new trees and shrubs can be placed on neighboring property
that would cast a shadow greater than 10 percent of a collector
absorption area between the hours of 10 am and 2 pm.
– Exceptions are made if the tree is on designated timberland, or
the tree provides passive cooling with net energy savings
exceeding that of the shaded collector
– First people were convicted in 2008 because of their redwoods
The Guilty Trees were Subject to
Court Ordered Pruning
Source: NYTimes, 4/7/08
Trang 17Solar Time vs Clock Time
• Most solar work deals only in solar time (ST)
• Solar time is measured relative to solar noon
• Two adjustments –
– For a longitudinal adjustment related to time zones
– For the uneven movement of the earth around the sun
• Problem with solar time –two places can only have the
same solar time is if they are directly north-south of
each other
• Solar time differs 4 minutes for 1˚ of longitude
• Clock time has 24 1-hour time zones, each spanning 15˚
of longitude
World Time Zone Map
Source: http://aa.usno.navy.mil/graphics/TimeZoneMap0802.pdf
Trang 18US Local Time Meridians (Table 7.4)
Time Zone Local Time Meridian
Alaska and Hawaii 150˚
Solar Time vs Clock Time
• The earth’s elliptical orbit causes the length of a solar
day to vary throughout the year
• Difference between a 24-h day and a solar day is given
by the Equation of Time E
• n is the day number
Trang 19Solar Time vs Clock Time
• Combining longitude correction and the Equation of
Time we get the following:
• CT – clock time
• ST – solar time
• LT Meridian – Local Time Meridian
• During Daylight Savings, add one hour to the local time
Solar Time (ST)=Clock Time (CT) +
Example 7.5 – Solar Time vs Local
Trang 20Example 7.5 – Solar Time vs Local
Time
• The local time meridian for Boston is 75˚, so the
difference is 75 ˚-71.7 ˚, and we know that each degree
Sunrise and Sunset
• Can approximate the sunrise and sunset times
• Solve (7.8) for where the altitude angle is zero
• + sign on HSR indicates sunrise, - indicates sunset
sinβ =cos cos cosL δ H +sin sin (7.8) L δ
sinβ =cos cos cosL δ H+sin sinL δ =0 (7.15)
sin sincos = tan tan (7.16)
°
Trang 21Sunrise and Sunset
• Weather service definition is the time at which the
upper limb (top) of the sun crosses the horizon, but the
geometric sunrise is based on the center
• There is also atmospheric refraction
• Adjustment factor Q
• Subtract this from the geometric sunrise
3.467
Q (min) (7.19) cos cos sinL δ H SR
=
Clear Sky Direct-Beam Radiation
• Direct beam radiation I BC – passes in a straight line
through the atmosphere to the receiver
• Diffuse radiation I DC – scattered by molecules in the
Trang 22• Starting point for clear sky radiation calculations
• I 0 passes perpendicularly through an imaginary surface
outside of the earth’s atmosphere
• I 0 depends on distance between earth and sun and on
intensity of the sun which is fairly predictable
• Ignoring sunspots, I 0can be written as
• SC = solar constant = 1.377 kW/m2
2 0
• In one year, less than half of I 0reaches earth’s surface
as a direct beam
• On a sunny, clear day, beam radiation may exceed 70%
of I 0
Figure 7.19
Trang 23Attenuation of Incoming Radiation
• Can treat attenuation as an exponential decay function
(7.21)
km B
• m = air mass ratio from (7.4)
Attenuation of Incoming Radiation
(7.21)
km B
365
Trang 24Solar Insolation on a Collecting
Surface
• Direct-beam radiation is just a function of the angle
between the sun and the collecting surface (i.e., the
incident angle θ):
• Diffuse radiation is assumed to be coming from
essentially all directions to the angle doesn’t matter; it
is typically between 6% and 14% of the direct value
• Reflected radiation comes from a nearby surface, and
depends on the surface reflectance, ρ, ranging down
from 0.8 for clean snow to 0.1 for a shingle roof
cos
Solar Insolation on a Collecting
Trang 25Tracking Systems
• Most residential solar systems have a fixed mount, but
sometimes tracking systems are cost effective
• Tracking systems are either single axis (usually with a
rotating polar mount [parallel to earth’s axis of
rotation), or two axis (horizontal [altitude, up-down]
and vertical [azimuth, east-west]
• Ballpark figures for tracking system benefits are about
20% more for a single axis, and 25 to 30% more for a
two axis
Monthly and Annual Insolation
• For a fixed system the total annual output is somewhat
insensitive to the tilt angle, but there is a substantial
variation in when the most energy is generated
Trang 26US Annual Insolation
Worldwide Annual Insolation
In 2007 worldwide PV peak was about 7800 MW, with almost half
(3860 MW) in Germany, 1919 MW in Japan, 830 in USA and
655 in Spain
Trang 27Tế bào quang điện
Pin quang điện
Trang 28Pin quang điện
Vật liệu quang điện
Trang 32Phổ năng lượng mặt trời
Phổ năng lượng mặt trời
Trang 33Ảnh hưởng của mức năng lượng lên
hiệu suất quang điện
Mối nối p-n
Trang 35Mối nối p-n
Diode dùng mối nối p-n
Trang 36Diode dùng mối nối p-n
Tế bào quang điện
Trang 37Mạch tương đương đơn giản của tế
bào quang điện
Mạch tương đương đơn giản của tế bào
quang điện
Trang 38Mạch tương đương đơn giản của tế bào
quang điện
Mạch tương đương đơn giản của tế bào
quang điện
Trang 39Mạch tương đương đơn giản của tế bào
quang điện
Mạch tương đương đơn giản của tế bào
quang điện
Trang 40Mạch tương đương đơn giản của tế bào
quang điện
Mạch tương đương chính xác của tế
bào quang điện
Trang 41Mạch tương đương chính xác của tế
bào quang điện
Mạch tương đương chính xác của tế
bào quang điện
Trang 42Mạch tương đương chính xác của tế
bào quang điện
Mạch tương đương chính xác của tế
bào quang điện
Trang 43Mạch tương đương chính xác của tế
bào quang điện
Mạch tương đương chính xác của tế
bào quang điện
Trang 44Ghép các tế bào quang điện
Ghép các tế bào thành tấm pin
Trang 45Ghép các tế bào thành tấm pin
Năng lượng mặt trời
Trang 46Ghép nối nhiều tấm pin
Ghép nối nhiều tấm pin
Trang 47Ghép nối nhiều tấm pin
Ghép nối nhiều tấm pin
Trang 48Đặc tuyến I-V của pin quang điện
Đặc tuyến I-V
Trang 49Đặc tuyến I-V
Năng lượng mặt trời
Trang 50Tác động của nhiệt độ và cường độ
bức xạ
Tác động của nhiệt độ và cường độ bức xạ
∆Isc = 0.05%/oC
∆Voc = - 0.37%/oC
∆PR = - 0.5%/oC
Trang 51Tác động do bóng che
Năng lượng mặt trời
Trang 55Năng lượng mặt trời
Tác động do bóng che
Trang 56Công nghệ chế tạo pin quang điện
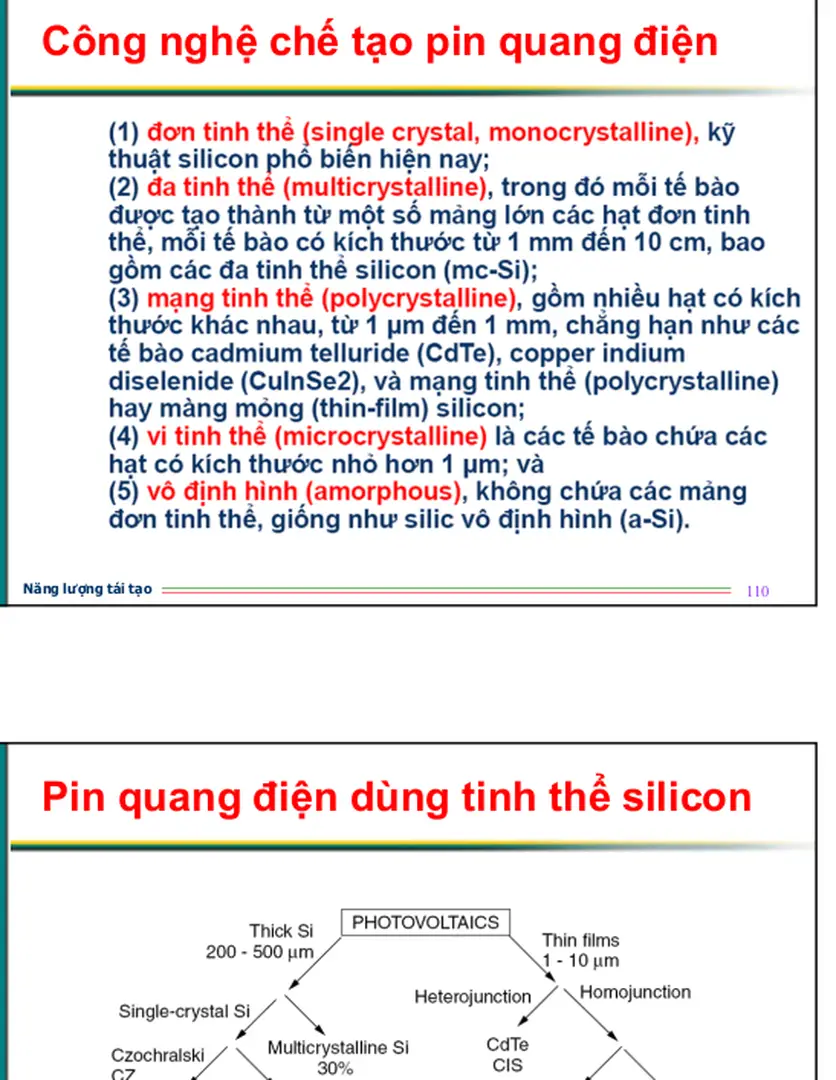
Pin quang điện dùng tinh thể silicon
Hình 8.45: Một cách phân nhánh để trình bày về các kỹ thuật quang
điện Tỷ lệ dựa theo thị phần PV vào cuối những năm 1990.
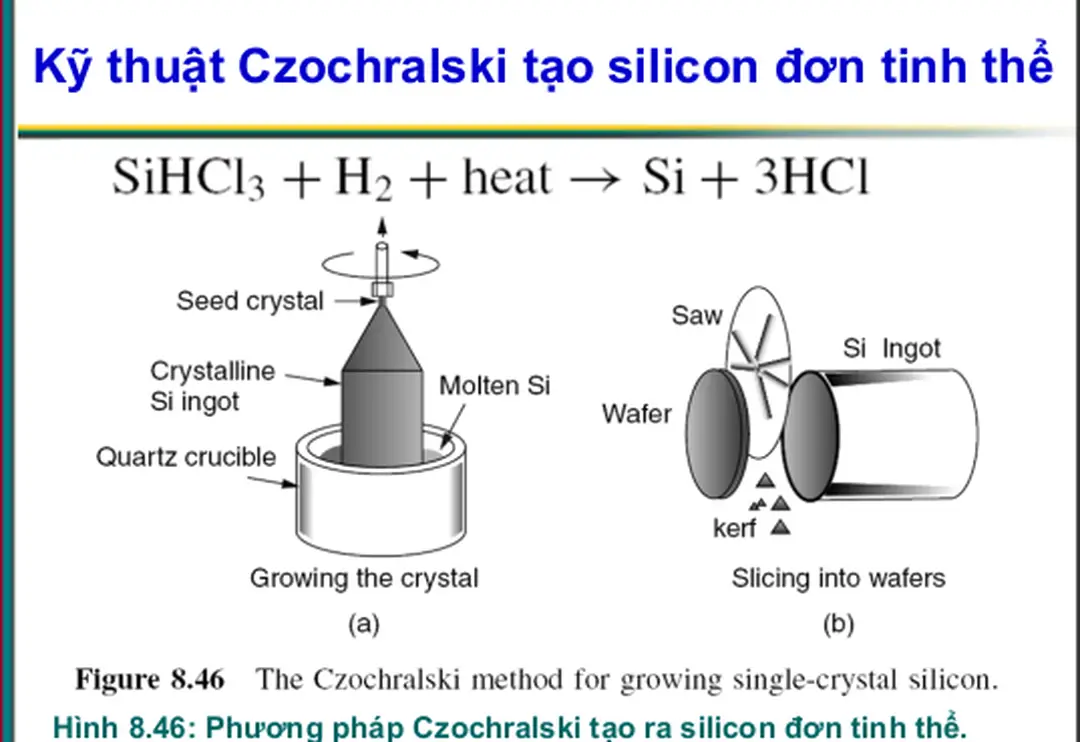
Trang 57Kỹ thuật Czochralski tạo silicon đơn tinh thể
Hình 8.46: Phương pháp Czochralski tạo ra silicon đơn tinh thể.
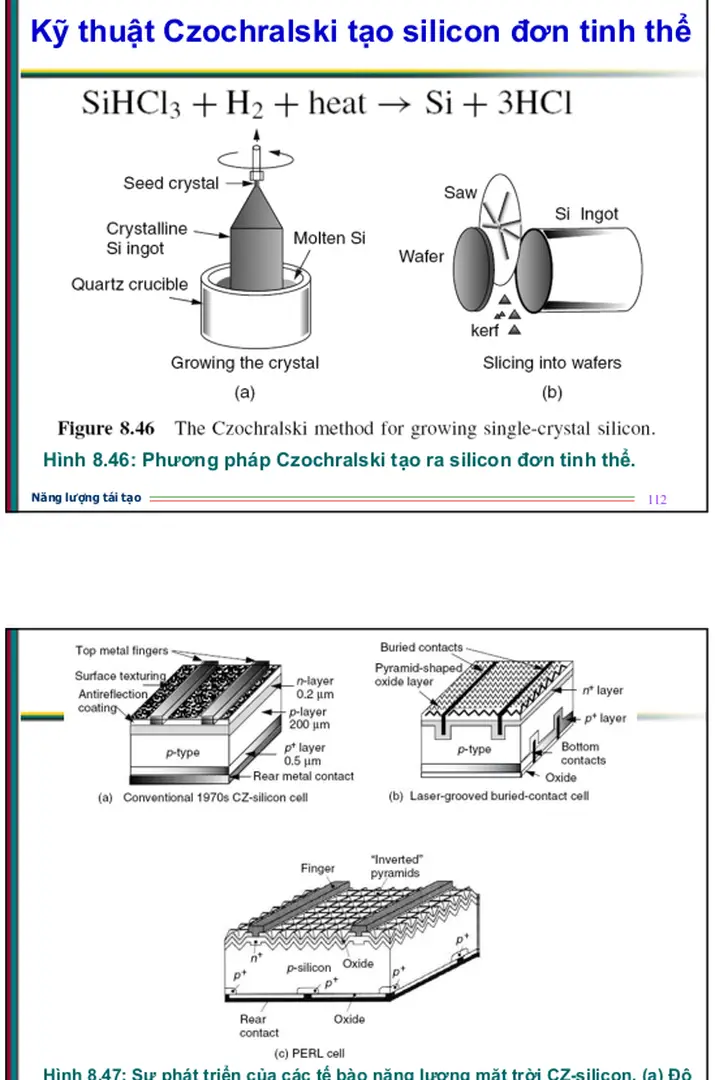
Hình 8.47: Sự phát triển của các tế bào năng lượng mặt trời CZ-silicon (a) Độ
dày của phiến bán dẫn của một tế bào những năm 1970 (b) Tế bào có rãnh
laser và điện cực chìm trên cả hai mặt (c) Tế bào PERL Theo Green (1993).
Trang 58Kỹ thuật Czochralski tạo silicon đơn tinh thể
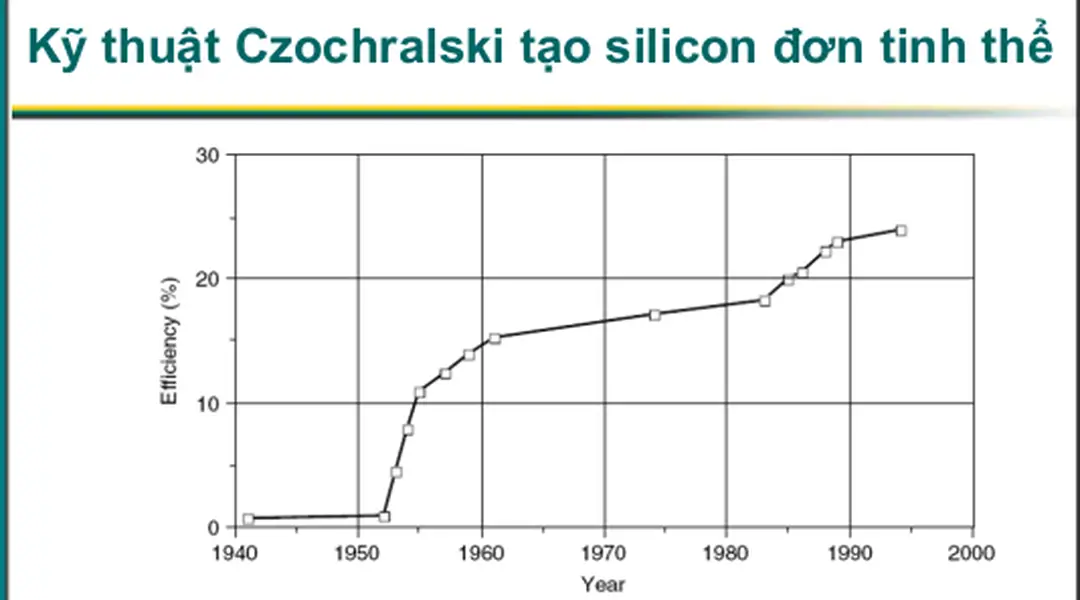
Hình 8.48: Tăng hiệu suất của các tế bào quang điện dùng silicon đơn tinh
thể trong phòng thí nghiệm Theo Bube (1998).
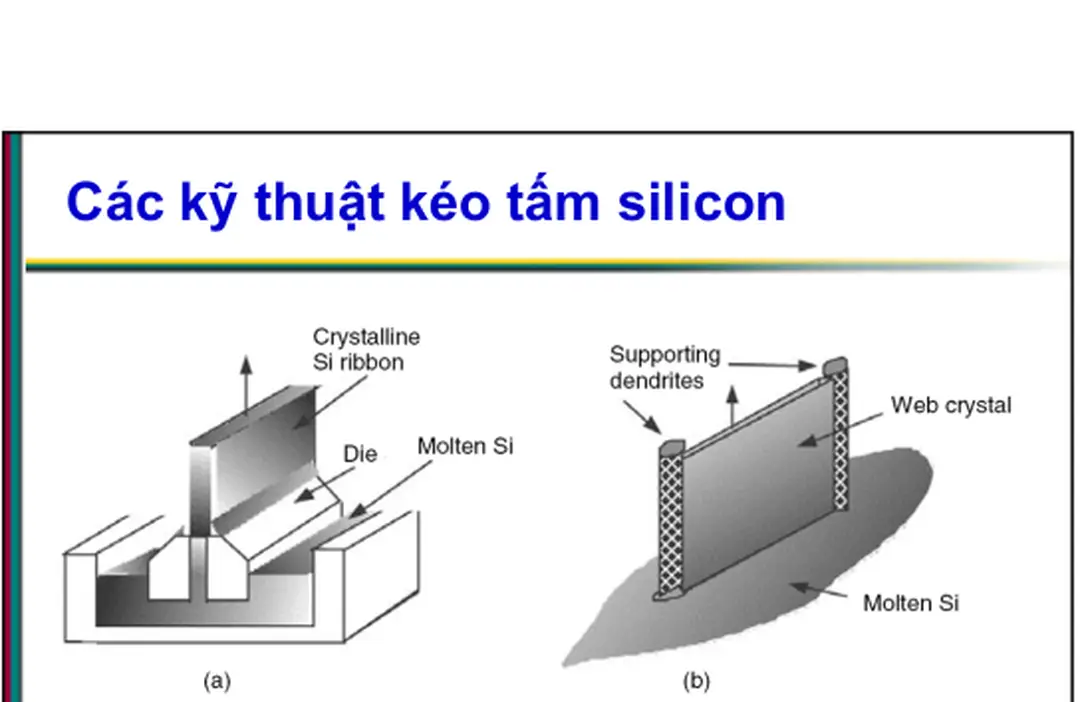
Các kỹ thuật kéo tấm silicon
Hình 8.49: Tấm tinh thể silicon có thể được kéo lên bằng phương pháp EFG
(a) hoặc sử dụng 2 thanh kéo song song (b).
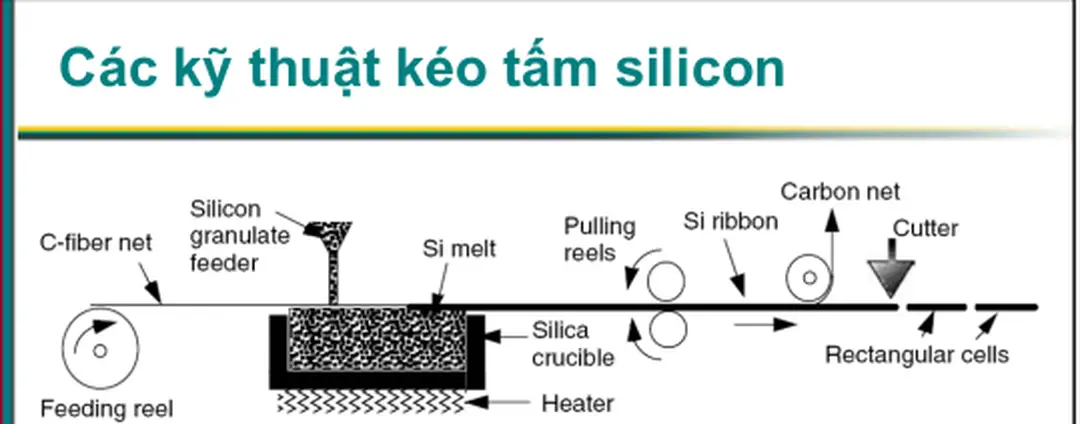
Trang 59Các kỹ thuật kéo tấm silicon
Hình 8.50: Quy trình S-Web tạo ra tấm silicon liên tục, có thể pha tạp chất kích
thích và cắt thành các tế bào hình chữ nhật Theo Schmela (2000).
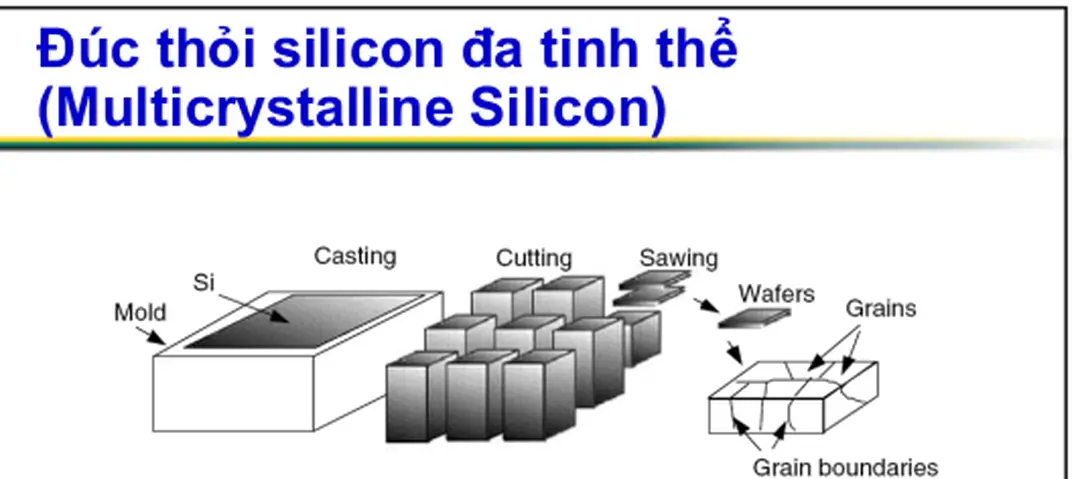
Đúc thỏi silicon đa tinh thể
(Multicrystalline Silicon)
Hình 8.51: Đúc, cắt và cưa silicon để tạo thành wafer chưa các hạt tinh thể
silicon, giữa các hạt tồn tại các lằn ranh phân chia.
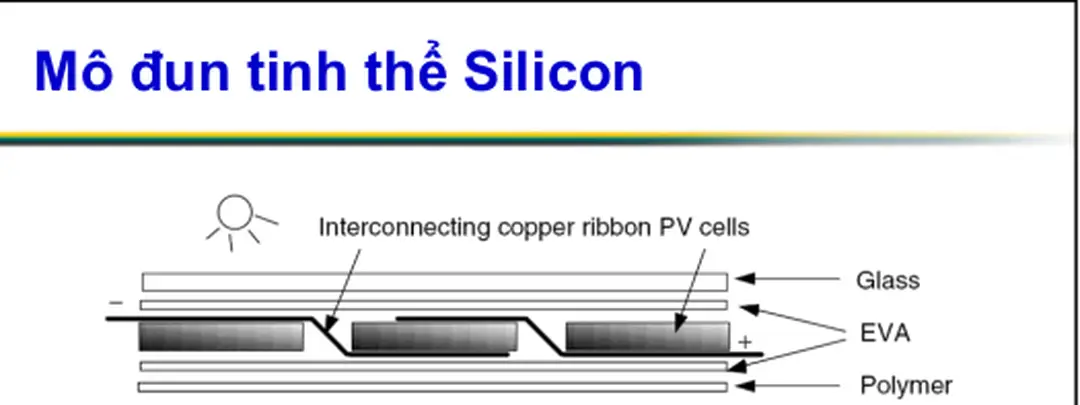
Trang 60Mô đun tinh thể Silicon
Hình 8.52: Các tế bào tinh thể được nối nối tiếp với nhau và sau đó được bảo
vệ giữa các lớp thủy tinh, EVA, và polyme.
PIN QUANG ĐIỆN MÀNG MỎNG (THIN-FILM)
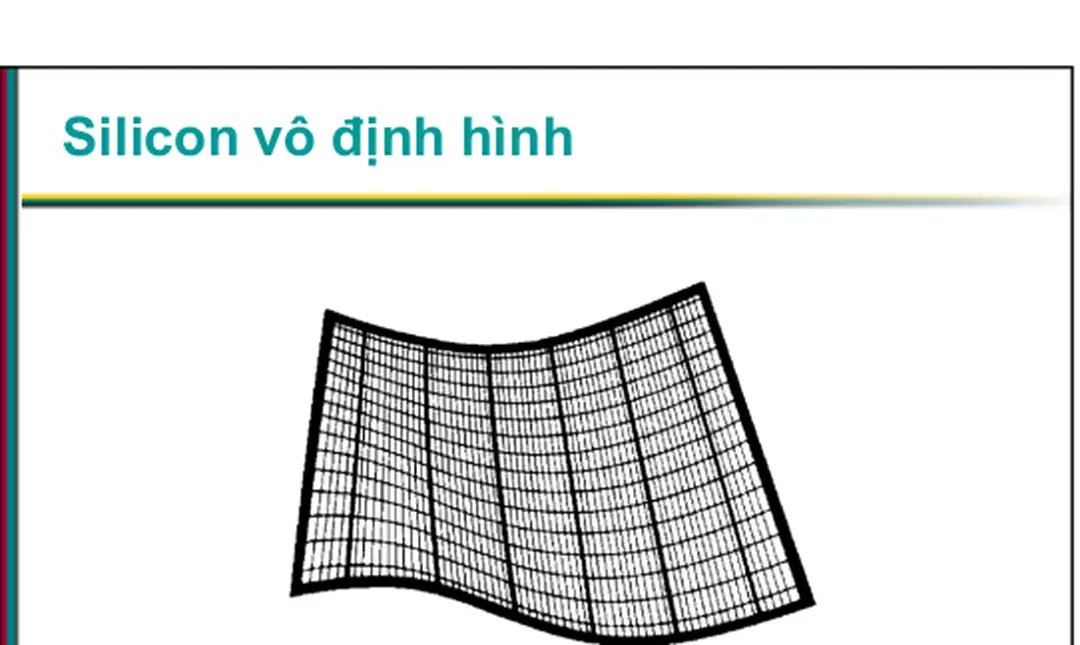
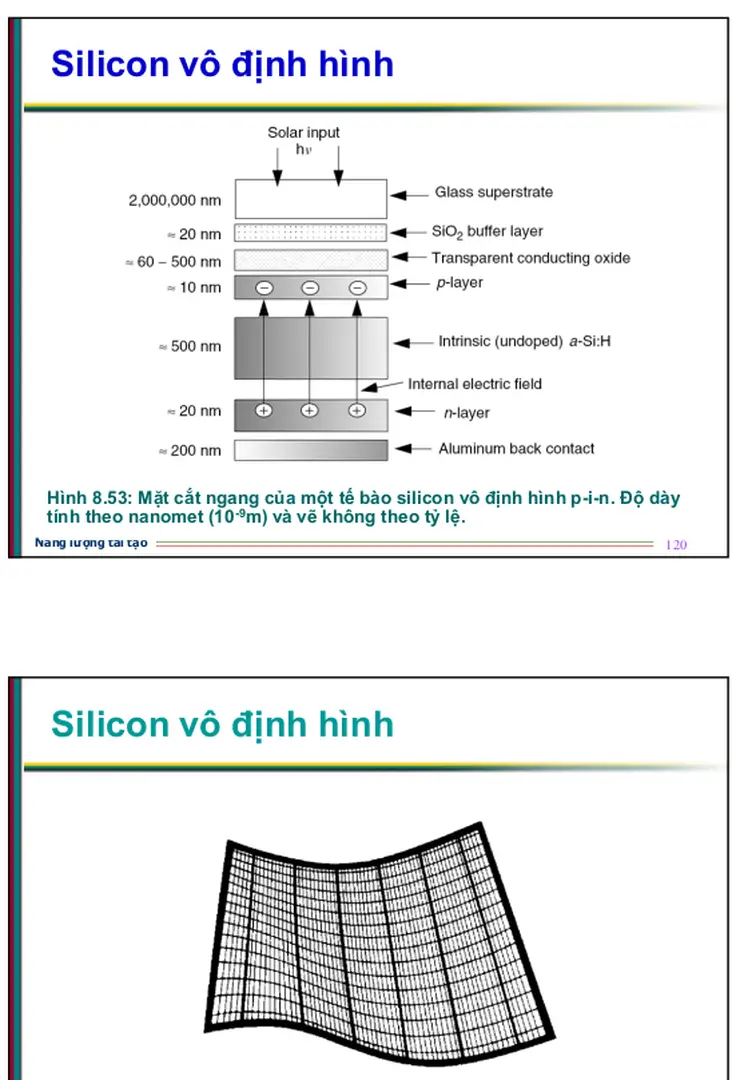
Trang 61Silicon vô định hình
Hình 8.53: Mặt cắt ngang của một tế bào silicon vô định hình p-i-n Độ dày
tính theo nanomet (10 -9 m) và vẽ không theo tỷ lệ.
Silicon vô định hình
Hình 8.54: Mô đun a-Si dạng linh hoạt có thể cuộn lại và để lưu trữ khi không
sử dụng Theo SERI (1985).
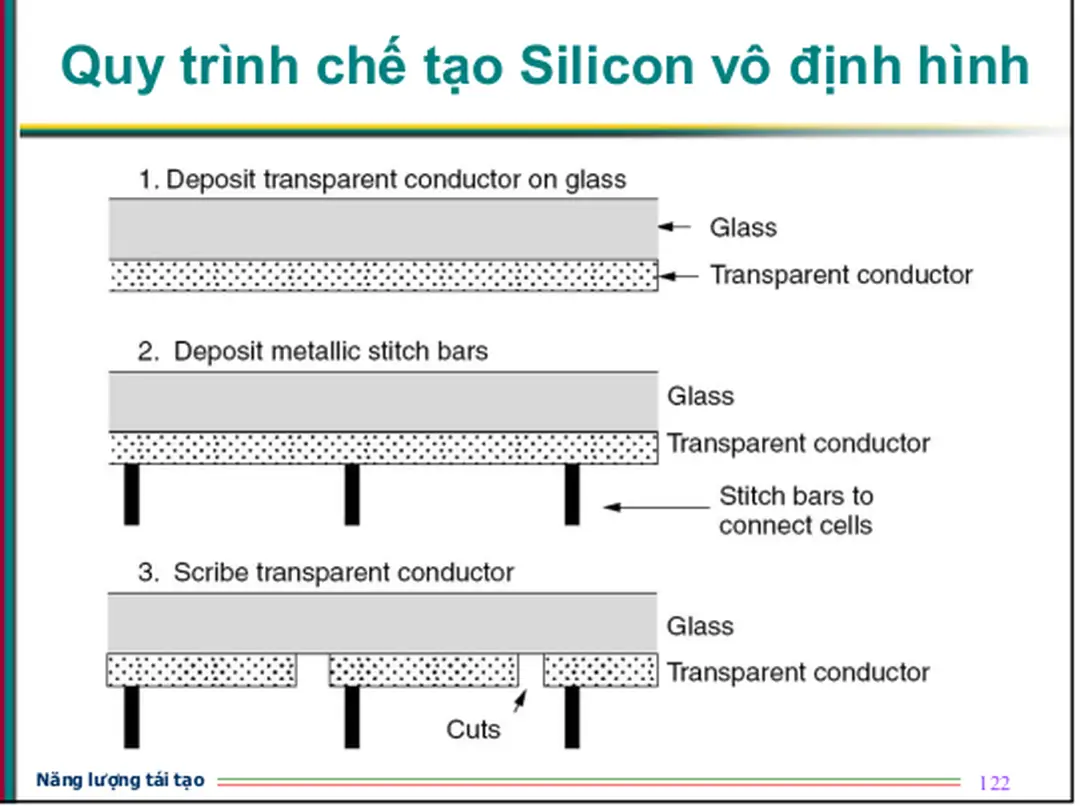
Trang 62Quy trình chế tạo Silicon vô định hình
Quy trình chế tạo Silicon vô định hình
Hình 8.55: Trình tự các bước thực hiện để tạo ra một môđun các tế bào
silicon vô định hình.
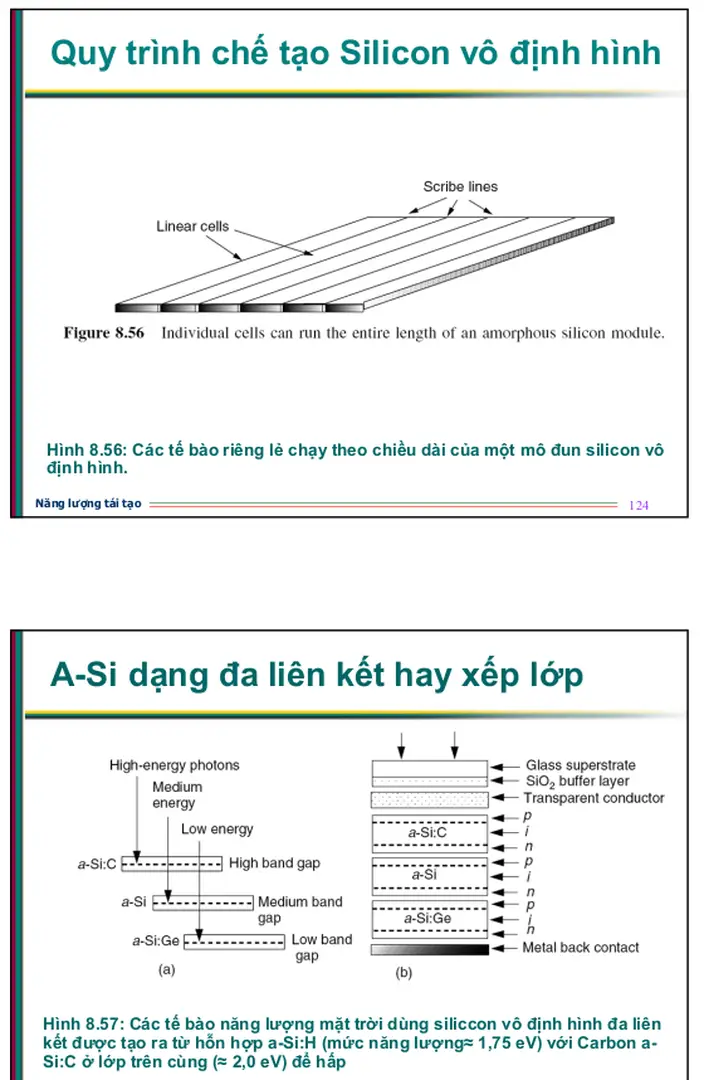
Trang 63Quy trình chế tạo Silicon vô định hình
Hình 8.56: Các tế bào riêng lẻ chạy theo chiều dài của một mô đun silicon vô
định hình.
A-Si dạng đa liên kết hay xếp lớp
Hình 8.57: Các tế bào năng lượng mặt trời dùng siliccon vô định hình đa liên
kết được tạo ra từ hỗn hợp Si:H (mức năng lượng≈ 1,75 eV) với Carbon
a-Si:C ở lớp trên cùng (≈ 2,0 eV) để hấp
Trang 64Gallium Arsenide and Indium Phosphide
Gallium Arsenide and Indium Phosphide
