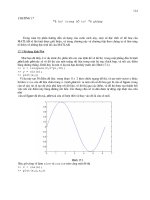
Giáo trình mathlab toàn tập - Chương 16 doc

Giáo trình mathlab toàn tập - Chương 16 doc
... vẽ 16. 5. -1 -0 .5 0 0.5 1 1.5 2 -1 0 0 10 20 30 40 50 Hình 16. 4 -1 -0 .5 0 0.5 1 1.5 2 -1 0 0 10 20 30 40 50 60 70 80 Hình 16. 5 Tính toán các vùng này bằng hàm y = humps(x) với -1 <x<2 ... nghiên cứu thêm thì hÃy tham khảo thêm phần trợ giúp trực tuyến của chúng. -3 -2 -1 0 1 2 3 -4 -3 -2 -1 0 1 2 3 4 Hình 16. 10...
Ngày tải lên: 24/07/2014, 23:20
Giáo trình mathlab toàn tập - Chương 17 doc
... >> plot(x,y),axis([0 2*pi -1 1]),title('sin(x)') >> subplot(2,2,2) % pick the upper right of the 4 subplots >> plot(x,z),axis([0 2*pi -1 1]),title('cos(x)') ... >> plot(x,z),axis([0 2*pi -1 1]),title('cos(x)') >> subplot(2,2,3)% pick the lowwer left of the 4 subplots >> plot(x,a),axis([0 2*pi -1 1]),title(&apo...
Ngày tải lên: 24/07/2014, 23:20

Giáo trình mathlab toàn tập - Chương 7 doc
... (2x4). ans= 1 1 1 1 1 1 1 1 >> zeros(3) + pi ans= 3.1 416 3.1 416 3.1 416 3.1 416 3.1 416 3.1 416 3.1 416 3.1 416 3.1 416 Ví dụ trên về tạo ma trận 3x3 với các phần tử đều là . >> ... v1=vmag(1)*cos(theta-vphase(1)); v2=vmag(2)*cos(theta-vphase(2)); v3=vmag(3)*cos(theta-vphase(3)); thd=theta*180/pi; plot(thd,v1,thd,v2,thd,v3) Sau khi chạy chơng tr...
Ngày tải lên: 24/07/2014, 23:20

Giáo trình mathlab toàn tập - Chương 6 doc
... y= -3 -2 2 3 mảng logic làm việc với ma trận cũng nh là đối với vector: >> B = [5 -3 ; 2 -4 ] B= 5 -3 2 -4 >> x = abs(B)>2 x= 1 1 0 0 >> y = B(x) 5 -3 ... A.* (-1 ).^A B= -1 4 -7 2 -5 8 30 7 8 9 10 12 13 14 15 >> ans - h % Lấy kết quả trớc trừ đi mảng h, ta đợc lại mảng g. ans= 1 2 3 4 5 6...
Ngày tải lên: 24/07/2014, 23:20

Giáo trình mathlab toàn tập - Chương 4 docx
... bảng d- ới đây. Thêm vào đó bạn có thể xem và sửa đờng dẫn của MATLAB (matlabpath). Những đờng dẫn này chỉ cho MATLAB nơi chứa script file và hàm M_file trong máy tính của bạn. Có rất nhiều tr- ờng ... khi tính toán cho nhiều trờng hợp, lệnh input cho phép bạn tạo câu nhắc để vào dữ liệu đợc an toàn. Ví dụ example1.m với những phần đợc sửa: function example1 % example1.m Ví dụ ớc lợ...
Ngày tải lên: 24/07/2014, 23:20
Giáo trình mathlab toàn tập - Chương 2 docx
... là ớc số chung lớn nhất của 18 và 81 ans= 9 >> lcm(18,81) % 162 là bội số chung lớn nhất của 18 và 81 ans= 162 Ví dụ: Ước lợng chiều cao của ngôi nhà Vấn đề: Giả thiết biết ... 20267.47 >> Diff = T2 - T1 Diff= 651.41 Nh vậy ta có giải pháp thứ nhất giá rẻ hơn giải pháp thứ hai. Ví dụ: Vấn đề nồng độ acid Vấn đề: Nh một phần của quá trình sản xuất...
Ngày tải lên: 24/07/2014, 23:20

Giáo trình mathlab toàn tập - Chương 23 potx
... một số đặc điểm khác 160 20 .16 Tự làm 161 20.17 Giải phơng trình 161 20.18 Giải phơng trình đại số đơn giản 161 20.19 Một vài phép toán đại số 162 20.20 Phép toán vi phân 162 20.21 Một vài ... khiển 165 21.1 Sự biểu diễn bằng đồ thị 165 21.2 Đối tợng LTI 166 21.3 Khôi phục dữ liệu 168 21.4 Sự nghịch đảo đối tợng LTI 168 21.5 Thuật toán đối tợng LTI 169 21.6 Phân...
Ngày tải lên: 24/07/2014, 22:24
Giáo trình mathlab toàn tập - Chương 22 pdf
... toán ma trận lyap Giải phơng trình Lyapunop liên tục dlyap Giải ph ơng trình Lyapunop rời rạc care Giải phơng trình đại số Riccati liên tục dare Giải phơng trình đại số Riccati rời rạc ... 174 Công cụ thiết kế LQG lqr, dlqr Bộ điều chỉnh hồi tiếp và phơng trình bậc hai tuyến tính lqry Bộ điều chỉnh LQ với đầu ra phụ lqrd Bộ biến đổi LQ rời rạc sang ... sau đó phân tích nó....
Ngày tải lên: 24/07/2014, 22:24
Giáo trình mathlab toàn tập - Chương 21 potx
... số đặc điểm của, hÃy tham chiếu đến đối tợng LTI open-loop và closed-loop. >> g = zpk ( [ ], [ 0, -5 , -1 0 ], 100 ) % hệ thống open-loop Zero/pole/gain : 100 s (s+5 ) ( s+ 10 ) ... >> a = [ 0 1 ; -2 -4 ] ; b = [ 0 1 ]; c = [ 1 1 ] ; d =0; % đinh nghĩa ma trận không gian trạng thái >> system2=ss( a, b, c, d) a= x1 x2 x1 0 1.00000 x -2 .00...
Ngày tải lên: 24/07/2014, 22:24
Giáo trình mathlab toàn tập - Chương 20 ppt
... (x^2 - 1)*(x - 2)*(x - 3) % tạo một hàm f = (x^2 - 1)*(x - 2)*(x - 3) >> collect(f) % gom tất cả các mục nhnhau ans = x^4 - 5*x^3 + 5*x^2 + 5*x - 6 >> horner(ans) ans = -6 ... chuỗi có chứa biểu thức: >> solve('a*x^2 + b*x - (-c)') ans = [1/2/a*(-b + (b^2 - 4*a*c)^(1/2))] [1/2/a*(-b - (b^2 - 4*a*c)...
Ngày tải lên: 24/07/2014, 22:24