MATLAB Demystified phần 7 docx

MATLAB Demystified phần 7 docx
... equation. 0 1 2 3 4 5 6 7 8 9 10 −1 −0.8 −0.6 −0.4 −0.2 0 0.2 0.4 0.6 0.8 1 t Figure 7- 7 The functions x (solid line) and y (dashed line) that solve the system in Example 7- 2 214 MATLAB Demystifi ... 6 −4 −3 −2 −1 0 1 2 3 4 t Figure 7- 11 Reworking Example 7- 2 by setting the initial condition to y(0) = y′(0) = 1 198 MATLAB Demystifi ed (leaving out the constant of integratio...
Ngày tải lên: 12/08/2014, 21:20

MATLAB Demystified phần 8 docx
... original data: SQFT 1200 1500 175 0 2000 2250 2500 275 0 3000 3500 4000 Average Price (thousands) $135 $142 $156 $165 $ 170 $220 $225 $ 275 $300 $450 Predicted $95 $126 $152 $ 178 $204 $230 $255 $281 $333 ... it in MATLAB: >> F = (–s^2 – 9*s + 4)/(s^2 + s + 2); Here is the result: >> ilaplace(F) ans = –dirac(t) –8*exp(–1/2*t)*cos(1/2 *7^ (1/2)*t)+20 /7* 7^(1/2)* exp(–1/2*t)*sin...
Ngày tải lên: 12/08/2014, 21:20

MATLAB Demystified phần 9 docx
... () ln .1 0 577 215 0 etdt t γ K THE GAMMA FUNCTION IN MATLAB The gamma function of n can be accessed in MATLAB by writing: x = gamma(n) For example, Γ(6) = 5! = 120 Checking this in MATLAB: >> ... is a functional relationship between the two. Age Max Weight 15 330 17 370 18 405 19 420 24 550 30 580 35 600 37 580 1. Use MATLAB to find the coefficients m and b for a first or...
Ngày tải lên: 12/08/2014, 21:20

MATLAB Demystified phần 10 docx
... and, 220, 2 27 Bessel’s, 266 dsolve command for, 161 Laplace transform for, 2 27 231 ordinary, 161–169 phase plane plots and, 169– 177 symbolic calculus for, 161– 177 systems of, 169– 177 Dirac delta ... 266– 273 built-in, 269 decaying oscillators and, 271 derivative of, 2 67 268 of fi rst kind, 266, 2 67 Hankel function and, 269, 270 , 272 of second kind, 266 symbolic computat...
Ngày tải lên: 12/08/2014, 21:20
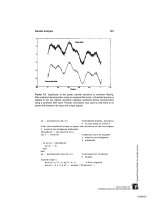
Biosignal and Biomedical Image Processing MATLAB-Based Applications phần 7 docx
... bank. Examine the high frequency subband for evidence of the discontinuity. % Example 7. 5 and Figures 7. 10 and 7. 11. Discontinuity detection % Construct a waveform of 2 sinusoids with a discontinuity % ... illustrated in the lower half of Figure 7. 12. This will lead to 8 output segments that are stored sequen- tially in the output vector, a . % Example 7. 5 and Figure 7. 13 % Exampl...
Ngày tải lên: 05/08/2014, 09:45

Accounting Demystified phần 7 pps
... directors of a company may declare a divi- 10288$ CH16 08-29-03 08:31: 37 PS 120 Accounting Demystified MTWThF 1234 78 91011 14 15 16 17 18 21 22 23 24 25 28 29 30 31 The amount of payroll that should ... Figure 17- 4. If there are numerous items, there should be a separate section for each category, as shown in Figure 17- 5. When you add other income to operating income and sub- 10288$...
Ngày tải lên: 06/08/2014, 10:20

Engineering Matlab Problem Solving phần 7 docx
... script is: 0 25.0000 10.0000 18.9811 20.0000 15. 377 3 30.0000 13.2196 40.0000 11.9 277 50.0000 11.1542 60.0000 10.6910 70 .0000 10.4138 80.0000 10.2 477 90.0000 10.1483 100.0000 10.0888 The resulting ... problem. >> x = x + (x==0)*eps x= -1.0000 -0.66 67 -0.3333 0.0000 0.3333 0.66 67 1.0000 >> sin(x)./x ans = 0.8415 0.9 276 0.9816 1.0000 0.9816 0.9 276 0.8415 Logical Operato...
Ngày tải lên: 12/08/2014, 16:21

MATLAB Demystified phần 1 pps
... 178 CHAPTER 7 Numerical Solution of ODEs 179 Solving First Order Equations with ODE23 and ODE45 179 Solving Second Order Equations 188 Quiz 196 CHAPTER 8 Integration 1 97 The Int Command 1 97 Defi ... of 433.12 multiplied by 15 .7. We type 433.12 * 15 .7 at the MATLAB prompt and hit the enter key. The result looks like this: >> 433.12*15 .7 ans = 6.8000e+003 MATLAB spits...
Ngày tải lên: 12/08/2014, 21:20

MATLAB Demystified phần 2 pptx
... Let’s try a larger matrix: >> magic(8) ans = 64 2 3 61 60 6 7 57 9 55 54 12 13 51 50 16 17 47 46 20 21 43 42 24 40 26 27 37 36 30 31 33 32 34 35 29 28 38 39 25 41 23 22 44 45 19 18 48 ... inverse must exist. MATLAB spits it out for us: >> T = inv(S) T = –0.9259 0.4815 0.4815 0.1111 –0.6296 0.1 574 0.6 574 0.0556 –0.5926 0.1481 0.1481 0.1111 0.66 67 –0.16 67 –0...
Ngày tải lên: 12/08/2014, 21:20

MATLAB Demystified phần 3 ppt
... set(h,'ShowText','on','TextStep',get(h,'LevelStep')*2) This time, MATLAB puts labels on each curve, as shown in Figure 3-38. Figure 3- 37 A contour plot of z = x 2 + y 2 CHAPTER 3 Plotting and Graphics 75 Now we enter the function ... in Figure 3- 17. At this point you should have a handle on the basics needed to generate plots in MATLAB. Now le...
Ngày tải lên: 12/08/2014, 21:20