SAS/ETS 9 22 User''''''''s Guide 10 pps

SAS/ETS 9.22 User''''s Guide 10 pps
... cpi FORECAST STD L95 U95 RESIDUAL 1 JUN 199 0 1 29. 9 . . . . . 2 JUL 199 0 130.4 130.368 0.36160 1 29. 660 131.077 0.03168 3 AUG 199 0 131.6 130.881 0.36160 130.172 131. 590 0.7 190 9 4 SEP 199 0 132.7 132.354 ... Chicago JAN90 ACTUAL 0 128 .100 2 Chicago JAN90 FORECAST 0 128.252 3 Chicago JAN90 RESIDUAL 0 -0.152 4 Chicago FEB90 ACTUAL 0 1 29. 200 5 Chicago FEB90 FORECAST 0 128. 896 6 Chic...
Ngày tải lên: 02/07/2014, 14:21

SAS/ETS 9.22 User''''s Guide 5 pps
... regression parameters – specification tests Time Series Interpolation and Frequency Conversion ✦ 39 have many series to forecast and you want to extrapolate trends without developing a model for
Ngày tải lên: 02/07/2014, 14:21

SAS/ETS 9.22 User''''s Guide 6 ppsx
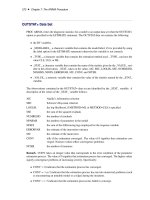
... (SAS/STAT User’s Guide) . For more information about the SAS Output Delivery system, refer to the SAS Output Delivery System: User’s Guide. Related SAS Software Many features not found in SAS/ETS software ... enable graphical output from SAS/ETS procedures, you must use the following statement in your SAS program. ods graphics on; The graphical output produced by many SAS/ETS procedu...
Ngày tải lên: 02/07/2014, 14:21

SAS/ETS 9.22 User''''s Guide 11 ppsx
... max Consumer 1 29. 9 136.2 Price Index * * JUN 199 0 1 29. 90 |c | JUL 199 0 130.40 | c | AUG 199 0 131.60 | c | SEP 199 0 132.70 | c | OCT 199 0 133.50 | c | NOV 199 0 133.80 | c | DEC 199 0 133.80 | c | JAN 199 1 134.60 ... datetime datetime10.; datalines; 91 10 16 21 61 91 10 17 0 56 91 10 17 3 53 more lines Computing the Ceiling of an Interval ✦ 101 datalines; 15jun 199 0 1...
Ngày tải lên: 02/07/2014, 14:21

SAS/ETS 9.22 User''''s Guide 23 pps
... Approx Parameter Estimate Error t Value Pr > |t| Lag Variable Shift MU 199 .83602 2 .99 463 66.73 <.0001 0 sales 0 NUM1 -9. 992 99 0.02885 -346.38 <.0001 0 price 0 Any number of input variables ... zero-one indicator for the month of the advertising effort. data a; set a; ad = (date = '1mar 199 2'd); run; proc arima data=a; identify var=sales crosscorr=ad; estimate p=1 q=1...
Ngày tải lên: 02/07/2014, 14:21
SAS/ETS 9.22 User''''s Guide 25 pps
... statistic is used. If WHITENOISE=ST, a modification of this statistic suggested by Stoffer and Toloi ( 199 2) is used. The default is WHITENOISE=ST. Options for Output Data Sets The following options are ... statistic is used. If WHITENOISE=ST, a modification of this statistic suggested by Stoffer and Toloi ( 199 2) is used. The default is WHITENOISE=ST. ESTIMATE Statement < label: >ESTIM...
Ngày tải lên: 02/07/2014, 14:21
SAS/ETS 9.22 User''''s Guide 29 pps
... The test statistic is based on the chi-square approximation suggested by Box and Jenkins ( 197 6, pp. 395 – 396 ). The cross-correlation function is computed by using the residuals from the model as ... Simulated IMA Model ✦ 281 title1 'Simulated IMA(1,1) Series'; data a; u1 = 0 .9; a1 = 0; do i = -50 to 100 ; a = rannor( 32565 ); u = u1 + a - .8 * a1; if i > 0 then output; a1...
Ngày tải lên: 02/07/2014, 14:21

SAS/ETS 9.22 User''''s Guide 35 pps
... 0.0076 0 .93 04 0.0073 0 .93 19 2 0.0150 0 .99 25 0.0143 0 .99 29 3 0.02 29 0 .99 91 0.0217 0 .99 92 4 0.0308 0 .99 99 0.0 290 0 .99 99 5 0.0367 1.0000 0.0345 1.0000 6 0.0442 1.0000 0.0413 1.0000 7 0.0 522 1.0000 ... 218.8 6103 6 Observations 120 MSE 1.82384 Uncond Var 1.6 299 733 Log Likelihood -187.44013 Total R-Square 0 .99 41 SBC 408. 392 693 AIC 388.88025 MAE 0 .97 051406 AICC 3 89...
Ngày tải lên: 02/07/2014, 14:21
SAS/ETS 9.22 User''''s Guide 39 pps
... model (Engle and Ng 199 3), the threshold GARCH (TGARCH) model (Glosten, Jaganathan, and Runkle 199 3; Zakoian 199 4), and the power GARCH (PGARCH) model (Ding, Granger, and Engle 199 3). For more details ... observation. This was also demonstrated by Maeshiro ( 197 6), Chipman ( 197 9), and Park and Mitchell ( 198 0). For large samples (Harvey and McAvinchey used 100 ), losing the first fe...
Ngày tải lên: 02/07/2014, 14:21
SAS/ETS 9.22 User''''s Guide 40 pps
... the number of estimated parameters. Refer to Judge et al. ( 198 5), Hurvich and Tsai ( 198 9), Schwarz ( 197 8) and Hannan and Quinn ( 197 9) for additional details. Testing ✦ 387 hypothesis that ˛ D ... k/ T k where the value of a is obtained from the table by Durbin ( 196 9) if the 1 2 .T k/ 1 Ä 60 . Edgerton and Wells ( 199 4) provided the method of obtaining the value of a for large s...
Ngày tải lên: 02/07/2014, 14:21
- matlab partial differential equations toolbox users guide
- user s guide to access don t panic
- user s guide to the indiana administrative code
- index to the user s guide to the ir database
- iphone sdk programming a beginner apos s guide 10 2009 attica
- wonderware® factorysuite™ intouch™ user s guide
- user s guide and online help
- user s guide to sulf ur