Chris Brooks Real Estate Modelling and Forecasting 1 ppt
Chris Brooks Real Estate Modelling and Forecasting_1 ppt
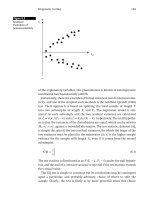
... hypothesis in favour of 17 0 Real Estate Modelling and Forecasting 25 20 15 10 (Regression residuals) 5 19 84 19 86 19 88 19 90 19 92 19 94 19 96 19 98 2000 2002 2004 2006 0 −5 10 15 Figure 6 .10 Regression residuals ... = 1. 1 2007M 01 1. 7 0.2 ( 1. 7 −0.2) = 1. 9 2007M02 2.3 1. 7 (2.3 − 1. 7) = 4.0 2007M03 0 .1 2.3 (0 .1 − 2.3) =−2.2 2007M04 0.0 0 .1 (0. 0 −0...
Ngày tải lên: 21/06/2014, 09:20
Chris Brooks Real Estate Modelling and Forecasting_5 docx
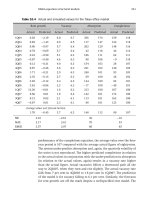
... −F Naive 2003 18 . 01 17 .06 −0.95 0.95 0.90 324.36 2 91. 10 12 .37 31. 81 2004 13 .30 14 .93 1. 63 1. 63 2.67 17 6.89 223.04 12 .37 0.86 2005 −3.64 11 .12 7.48 7.48 55. 91 13.25 12 3.59 12 .37 76. 21 2006 −4.24 ... −F Naive 2003 18 . 01 14 .19 −3.82 3.82 14 .57 324.36 2 01. 44 12 .37 31. 81 2004 13 .30 13 . 81 0. 51 0. 51 0.26 17 6.89 19 0.69 12 .37 0.86 2005 −3.64 12 .46 8.8...
Ngày tải lên: 21/06/2014, 09:20

Chris Brooks Real Estate Modelling and Forecasting_6 pdf
... 972.7 1Q05 −0.50 77,207 90,563 6.3 21, 300 11 1 19 ,949 11 1 1, 911 1, 017 .5 2Q05 −0.40 76,896 90,499 6.3 21, 410 11 0 20,055 10 6 1, 915 1, 015 .5 3Q05 −0. 31 76,656 90,564 6.3 21, 517 10 7 20 ,15 8 10 3 1, 920 ... 17 4 1, 909 476.9 2Q04 1. 43 78,904 90,403 6.5 20,958 11 8 19 ,592 14 7 1, 908 686.0 3Q04 −0.97 78 ,13 8 90,459 6.4 21, 074 11 6 19 ,7 21 129 1, 907 860.5...
Ngày tải lên: 21/06/2014, 09:20
Chris Brooks Real Estate Modelling and Forecasting_7 docx
... 10 2 3Q06 3.02 −0 .12 2.4 6.2 14 4 10 0 82 10 1 4Q06 3.62 −0.06 2.3 6.2 17 10 0 −40 10 1 1Q07 12 .36 −0. 01 1.8 6.2 213 10 0 10 7 10 0 2Q07 0.56 0. 01 1.9 6.2 14 2 10 1 17 4 10 0 3Q07 0 .12 0.02 2 .1 6 .1 113 10 1 ... 90,4 81 1 .1 21, 897 15 5 21, 650 16 7 0.62 1Q07 2.23 10 0,209 90,485 1. 1 22,058 16 1 21, 811 16 1 0.56 2Q07 1. 80 10 2, 012 90,427 1. 2 22,243 1...
Ngày tải lên: 21/06/2014, 09:20
Chris Brooks Real Estate Modelling and Forecasting_9 pptx
... by y t−k = ⎛ ⎜ ⎜ ⎝ α 11 α 12 α 13 α 14 ⎞ ⎟ ⎟ ⎠ β 11 β 12 β 13 β 14 ⎛ ⎜ ⎜ ⎝ y 1 y 2 y 3 y 4 ⎞ ⎟ ⎟ ⎠ t−k (12 .72) Equation (12 .72) can also be written y t−k = ⎛ ⎜ ⎜ ⎝ α 11 α 12 α 13 α 14 ⎞ ⎟ ⎟ ⎠ β 11 y 1 + ... 90.9 16 1.6 −3 .17 0.8 0.640 0. 71 4Q08 91. 5 16 2.4 −3.02 0.8 0.625 0.69 1Q09 91. 6 16 3.2 −3.39 0.8 0 .11 8 0 .13 2Q09 91. 8 16 4.0 −3.72 0...
Ngày tải lên: 21/06/2014, 09:20

Chris Brooks Real Estate Modelling and Forecasting_10 pdf
... 7 variables dummy 16 9– 71, 18 0, 18 2, 252–7 exogenous 258, 306, 308, 311 , 339, 352 explanatory 73, 75, 96, 10 9 12 irrelevant 13 0–2, 18 8, 242 macroeconomic 316 , 357 omission of 12 9–30, 15 2, 16 1, 219 ordering ... equations 305 16 Student’s t distribution 58–60 sub-sample 69, 17 9–85 Sydney office market 210 , 323, 390–4 t-ratio test 11 3 15 t-test 63, 10 1, 11 3, 12 4...
Ngày tải lên: 21/06/2014, 09:20

Real Estate Modelling and Forecasting Hardcover_14 pptx
... in Cointegration in real estate markets 411 11 5 Actual Forecast 11 4 11 3 11 2 11 1 11 0 10 9 10 8 10 7 Jan. 07 Feb. 07 Mar. 07 Apr. 07 May. 07 Jun. 07 Jul. 07 Figure 12 .12 Ex post VECM predictions 12 .10 The Johansen ... by y t−k = ⎛ ⎜ ⎜ ⎝ α 11 α 12 α 13 α 14 ⎞ ⎟ ⎟ ⎠ β 11 β 12 β 13 β 14 ⎛ ⎜ ⎜ ⎝ y 1 y 2 y 3 y 4 ⎞ ⎟ ⎟ ⎠ t−k (12 .72) Equation (12 .72) c...
Ngày tải lên: 20/06/2014, 20:20

Real Estate Modelling and Forecasting by Chris Brooks and Sotiris Tsolacos_2 pot
... Tokyo 200 12 0 10 0 80 60 60 40 20 0 −20 −40 −60 40 20 0 1Q93 19 71 1974 19 77 19 80 19 83 19 86 19 89 19 92 19 95 19 98 20 01 2004 2007 1Q96 1Q99 1Q02 3Q03 3Q06 1Q05 3Q94 3Q97 3Q00 0 1Q78 1Q80 1Q82 1Q84 1Q86 1Q88 1Q90 1Q92 1Q94 1Q96 1Q98 1Q00 1Q02 1Q04 1Q06 Figure ... 0.8 4.7 10 .4 10 .1 2006 9.6 8.0 11 .1 11. 7 2007 9.9 13 .3 11 .3 13 .3 Min −3.7 −2.0 Max 11 .3 13 .3...
Ngày tải lên: 21/06/2014, 07:20

Real Estate Modelling and Forecasting by Chris Brooks and Sotiris Tsolacos_3 doc
... analysis 81 25 (yoy%) (yoy%) 20 15 10 5 −5 10 1 −2 −3 15 −20 −25 19 79 19 81 1983 19 85 19 87 19 89 19 91 1993 19 95 19 97 19 99 20 01 2003 2005 19 79 19 81 1983 19 85 19 87 19 89 19 91 1993 19 95 19 97 19 99 20 01 2003 2005 0 (a) ... by ˆ β and adding ˆα will 84 Real Estate Modelling and Forecasting 20 (yoy %) Actual Fitted (%) 15 10 5 0 19 7...
Ngày tải lên: 21/06/2014, 07:20

Real Estate Modelling and Forecasting by Chris Brooks and Sotiris Tsolacos_4 ppt
... x 2 and not x 1 .So,whereis x 1 ? In fact, it is the constant term, usually represented by a column of ones of length T : x 1 = ⎡ ⎢ ⎢ ⎢ ⎣ 1 1 . . . 1 ⎤ ⎥ ⎥ ⎥ ⎦ (5.3) 11 2 Real Estate Modelling and ... k = 10 .96 15 − 3 = 0. 91 (5 .14 ) The variance–covariance matrix of ˆ β is given by s 2 (X X) 1 = 0. 91( X X) 1 = ⎡ ⎣ 1. 82 3 .19 −0. 91 3 .19 0. 91 5.92 −0....
Ngày tải lên: 21/06/2014, 07:20